library(tidyomics)
#> ── Attaching core tidyomics packages ──────────────────────── tidyomics 1.5.0 ──
#> ✔ dplyr                    1.1.4      ✔ tidyr                    1.3.1
#> ✔ ggplot2                  3.5.2      ✔ tidyseurat               0.8.0
#> ✔ nullranges               1.15.0     ✔ tidySingleCellExperiment 1.19.0
#> ✔ plyranges                1.29.0     ✔ tidySummarizedExperiment 1.19.0
#> ✔ tidybulk                 1.21.0
#> ── Conflicts ────────────────────────────────────────── tidyomics_conflicts() ──
#> ✖ plyranges::between()     masks dplyr::between()
#> ✖ tidybulk::bind_cols()    masks ttservice::bind_cols(), dplyr::bind_cols()
#> ✖ plyranges::filter()      masks tidybulk::filter(), dplyr::filter(), stats::filter()
#> ✖ S4Vectors::findMatches() masks utils::findMatches()
#> ✖ S4Vectors::head()        masks utils::head()
#> ✖ plyranges::n()           masks dplyr::n()
#> ✖ plyranges::n_distinct()  masks dplyr::n_distinct()
#> ✖ IRanges::relist()        masks BiocGenerics::relist(), utils::relist()
#> ✖ tidybulk::rename()       masks S4Vectors::rename(), dplyr::rename()
#> ✖ plyranges::slice()       masks IRanges::slice(), dplyr::slice()
#> ✖ IRanges::stack()         masks S4Vectors::stack(), utils::stack()
#> ✖ S4Vectors::tail()        masks utils::tail()
#> ✖ tidyseurat::tidy()       masks tidySingleCellExperiment::tidy(), tidySummarizedExperiment::tidy(), generics::tidy()
#> ℹ Use the conflicted package (<http://conflicted.r-lib.org/>) to force all conflicts to become errors
data(airway, package="airway")

airway
#> # A SummarizedExperiment-tibble abstraction: 509,416 × 23
#> # Features=63677 | Samples=8 | Assays=counts
#>    .feature        .sample   counts SampleName cell  dex   albut Run   avgLength
#>    <chr>           <chr>      <int> <fct>      <fct> <fct> <fct> <fct>     <int>
#>  1 ENSG00000000003 SRR10395…    679 GSM1275862 N613… untrt untrt SRR1…       126
#>  2 ENSG00000000005 SRR10395…      0 GSM1275862 N613… untrt untrt SRR1…       126
#>  3 ENSG00000000419 SRR10395…    467 GSM1275862 N613… untrt untrt SRR1…       126
#>  4 ENSG00000000457 SRR10395…    260 GSM1275862 N613… untrt untrt SRR1…       126
#>  5 ENSG00000000460 SRR10395…     60 GSM1275862 N613… untrt untrt SRR1…       126
#>  6 ENSG00000000938 SRR10395…      0 GSM1275862 N613… untrt untrt SRR1…       126
#>  7 ENSG00000000971 SRR10395…   3251 GSM1275862 N613… untrt untrt SRR1…       126
#>  8 ENSG00000001036 SRR10395…   1433 GSM1275862 N613… untrt untrt SRR1…       126
#>  9 ENSG00000001084 SRR10395…    519 GSM1275862 N613… untrt untrt SRR1…       126
#> 10 ENSG00000001167 SRR10395…    394 GSM1275862 N613… untrt untrt SRR1…       126
#> # ℹ 40 more rows
#> # ℹ 14 more variables: Experiment <fct>, Sample <fct>, BioSample <fct>,
#> #   gene_id <chr>, gene_name <chr>, entrezid <int>, gene_biotype <chr>,
#> #   gene_seq_start <int>, gene_seq_end <int>, seq_name <chr>, seq_strand <int>,
#> #   seq_coord_system <int>, symbol <chr>, GRangesList <list>
How to use tidy principles for RNA-seq data analysis
2025-06-19
Source:vignettes/how-to-use-tidy-principles-for-rna-seq-analysis.qmd
Tidy data principles are a set of principles for structuring data in a way that makes it easier to manipulate and analyze. They have been popularized by the tidyverse collection of R packages, which includes dplyr for data manipulation and ggplot2 for data visualization. The tidy principles can also be applied to biological data, such as RNA-seq data, to facilitate analysis and visualization, thanks to the tidyomics meta-package.
Bioconductor packages used in this document
How to manipulate SummarizedExperiment objects with tidy principles
For illustration, we use data from the airway package.
How airway object is printed is controlled by the tidySummarizedExperiment package, and by default it is displayed as a tibble-like object. Note that this behavior can be changed by setting the options(restore_SummarizedExperiment_show = TRUE) option.
# Turn off the tibble visualisation
options("restore_SummarizedExperiment_show" = TRUE)
airway
#> class: RangedSummarizedExperiment
#> dim: 63677 8
#> metadata(1): ''
#> assays(1): counts
#> rownames(63677): ENSG00000000003 ENSG00000000005 ... ENSG00000273492
#>   ENSG00000273493
#> rowData names(10): gene_id gene_name ... seq_coord_system symbol
#> colnames(8): SRR1039508 SRR1039509 ... SRR1039520 SRR1039521
#> colData names(9): SampleName cell ... Sample BioSample

# Turn on the tibble visualisation
options("restore_SummarizedExperiment_show" = FALSE)
airway
#> # A SummarizedExperiment-tibble abstraction: 509,416 × 23
#> # Features=63677 | Samples=8 | Assays=counts
#>    .feature        .sample   counts SampleName cell  dex   albut Run   avgLength
#>    <chr>           <chr>      <int> <fct>      <fct> <fct> <fct> <fct>     <int>
#>  1 ENSG00000000003 SRR10395…    679 GSM1275862 N613… untrt untrt SRR1…       126
#>  2 ENSG00000000005 SRR10395…      0 GSM1275862 N613… untrt untrt SRR1…       126
#>  3 ENSG00000000419 SRR10395…    467 GSM1275862 N613… untrt untrt SRR1…       126
#>  4 ENSG00000000457 SRR10395…    260 GSM1275862 N613… untrt untrt SRR1…       126
#>  5 ENSG00000000460 SRR10395…     60 GSM1275862 N613… untrt untrt SRR1…       126
#>  6 ENSG00000000938 SRR10395…      0 GSM1275862 N613… untrt untrt SRR1…       126
#>  7 ENSG00000000971 SRR10395…   3251 GSM1275862 N613… untrt untrt SRR1…       126
#>  8 ENSG00000001036 SRR10395…   1433 GSM1275862 N613… untrt untrt SRR1…       126
#>  9 ENSG00000001084 SRR10395…    519 GSM1275862 N613… untrt untrt SRR1…       126
#> 10 ENSG00000001167 SRR10395…    394 GSM1275862 N613… untrt untrt SRR1…       126
#> # ℹ 40 more rows
#> # ℹ 14 more variables: Experiment <fct>, Sample <fct>, BioSample <fct>,
#> #   gene_id <chr>, gene_name <chr>, entrezid <int>, gene_biotype <chr>,
#> #   gene_seq_start <int>, gene_seq_end <int>, seq_name <chr>, seq_strand <int>,
#> #   seq_coord_system <int>, symbol <chr>, GRangesList <list>
The airway object is a SummarizedExperiment object, and the tidySummarizedExperiment packages adds an invisible layer to abstract the SE object as a tibble. This allows us to use the dplyr package to manipulate the data, and eventually to directly plug data flow into ggplot2 for visualization.
airway |>
    filter(albut == "untrt") |>
    group_by(.feature, dex) |>
    summarise(tot_counts = sum(counts)) |>
    pivot_wider(names_from = dex, values_from = tot_counts) |>
    slice_sample(n = 10000) |>
    ggplot(aes(x = trt, y = untrt)) +
    geom_density_2d(color = "black", linewidth = 0.5) +
    geom_point(alpha = 0.1, size = 0.3) +
    scale_x_log10() +
    scale_y_log10() +
    annotation_logticks(side = 'bl') +
    labs(x = "Dex treated", y = "Dex untreated") +
    theme_bw()
#> tidySummarizedExperiment says: A data frame is returned for independent data analysis.
#> `summarise()` has grouped output by '.feature'. You can override using the
#> `.groups` argument.
#> Warning in scale_x_log10(): log-10 transformation introduced infinite values.
#> Warning in scale_y_log10(): log-10 transformation introduced infinite values.
#> Warning in scale_x_log10(): log-10 transformation introduced infinite values.
#> Warning in scale_y_log10(): log-10 transformation introduced infinite values.
#> Warning: Removed 36227 rows containing non-finite outside the scale range
#> (`stat_density2d()`).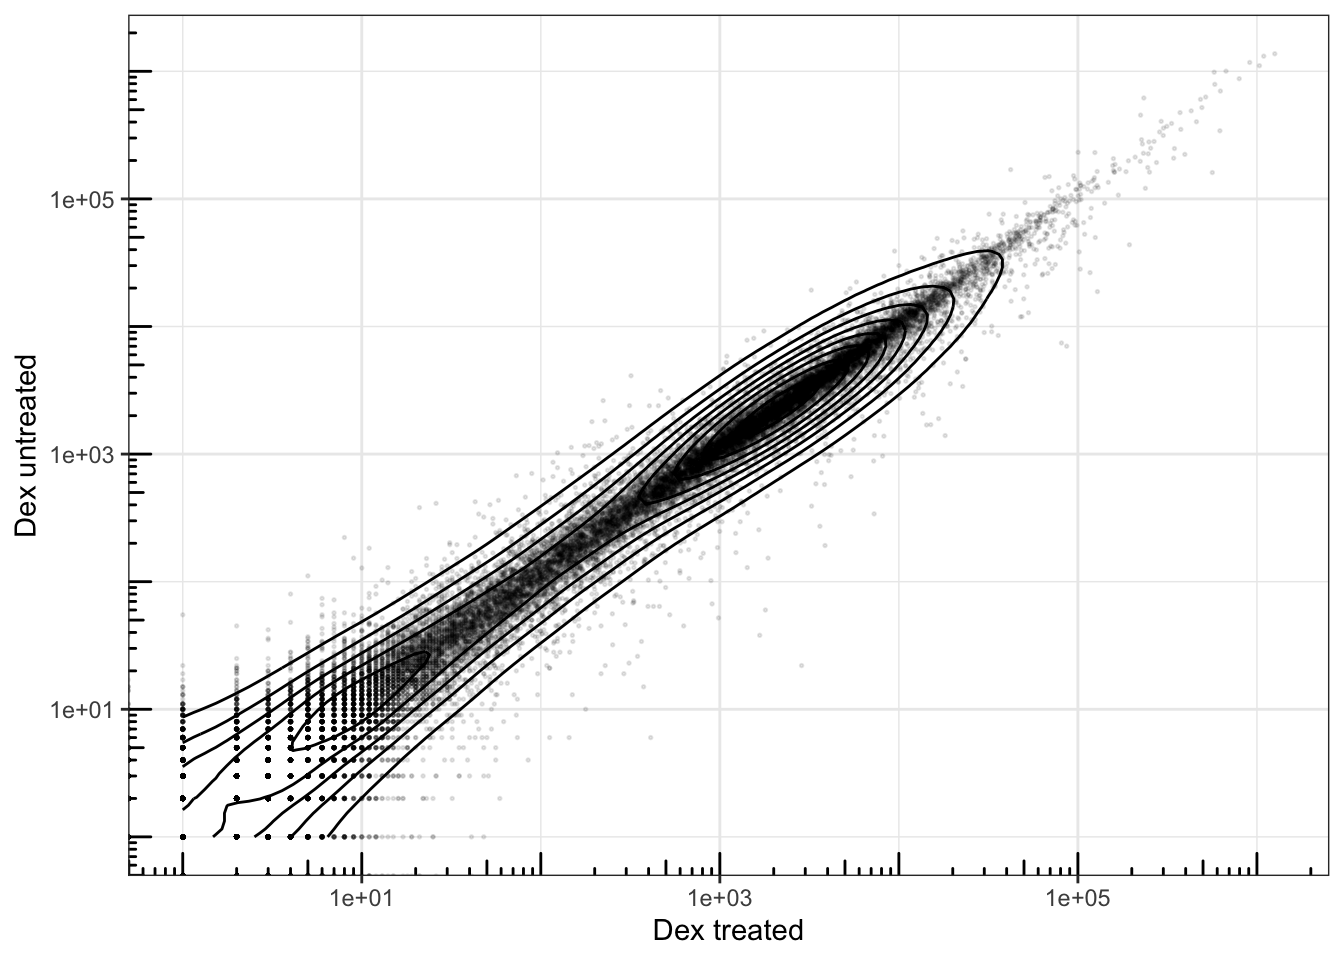
Because these tidy methods are defined for SummarizedExperiment objects, most classes built on top of SummarizedExperiment, such as DESeqDataSet or SingleCellExperiment, can also be manipulated with tidy principles. This has prompted the development of other packages (included in the tidyomics meta-package) that extend the tidy principles to other analyses, such as single-cell transcriptomics analysis.
data(pbmc_small, package="tidySingleCellExperiment")
pbmc_small
#> # A SingleCellExperiment-tibble abstraction: 80 × 17
#> # [90mFeatures=230 | Cells=80 | Assays=counts, logcounts[0m
#>    .cell orig.ident nCount_RNA nFeature_RNA RNA_snn_res.0.8 letter.idents groups
#>    <chr> <fct>           <dbl>        <int> <fct>           <fct>         <chr>
#>  1 ATGC… SeuratPro…         70           47 0               A             g2
#>  2 CATG… SeuratPro…         85           52 0               A             g1
#>  3 GAAC… SeuratPro…         87           50 1               B             g2
#>  4 TGAC… SeuratPro…        127           56 0               A             g2
#>  5 AGTC… SeuratPro…        173           53 0               A             g2
#>  6 TCTG… SeuratPro…         70           48 0               A             g1
#>  7 TGGT… SeuratPro…         64           36 0               A             g1
#>  8 GCAG… SeuratPro…         72           45 0               A             g1
#>  9 GATA… SeuratPro…         52           36 0               A             g1
#> 10 AATG… SeuratPro…        100           41 0               A             g1
#> # ℹ 70 more rows
#> # ℹ 10 more variables: RNA_snn_res.1 <fct>, file <chr>, ident <fct>,
#> #   PC_1 <dbl>, PC_2 <dbl>, PC_3 <dbl>, PC_4 <dbl>, PC_5 <dbl>, tSNE_1 <dbl>,
#> #   tSNE_2 <dbl>

## We can still manipulate the data with standard SummarizedExperiment methods
counts(pbmc_small)[1:5, 1:4]
#> 5 x 4 sparse Matrix of class "dgCMatrix"
#>         ATGCCAGAACGACT CATGGCCTGTGCAT GAACCTGATGAACC TGACTGGATTCTCA
#> MS4A1                .              .              .              .
#> CD79B                1              .              .              .
#> CD79A                .              .              .              .
#> HLA-DRA              .              1              .              .
#> TCL1A                .              .              .              .

## But we can also use tidy principles
pbmc_small |>
    extract(file, "sample", "../data/([a-z0-9]+)/outs.+") |>
    rename(annotation = letter.idents) |>
    ggplot(aes(sample, nCount_RNA, fill=sample)) +
    geom_boxplot(outlier.shape=NA) +
    geom_jitter(width=0.1) +
    facet_wrap( ~ annotation)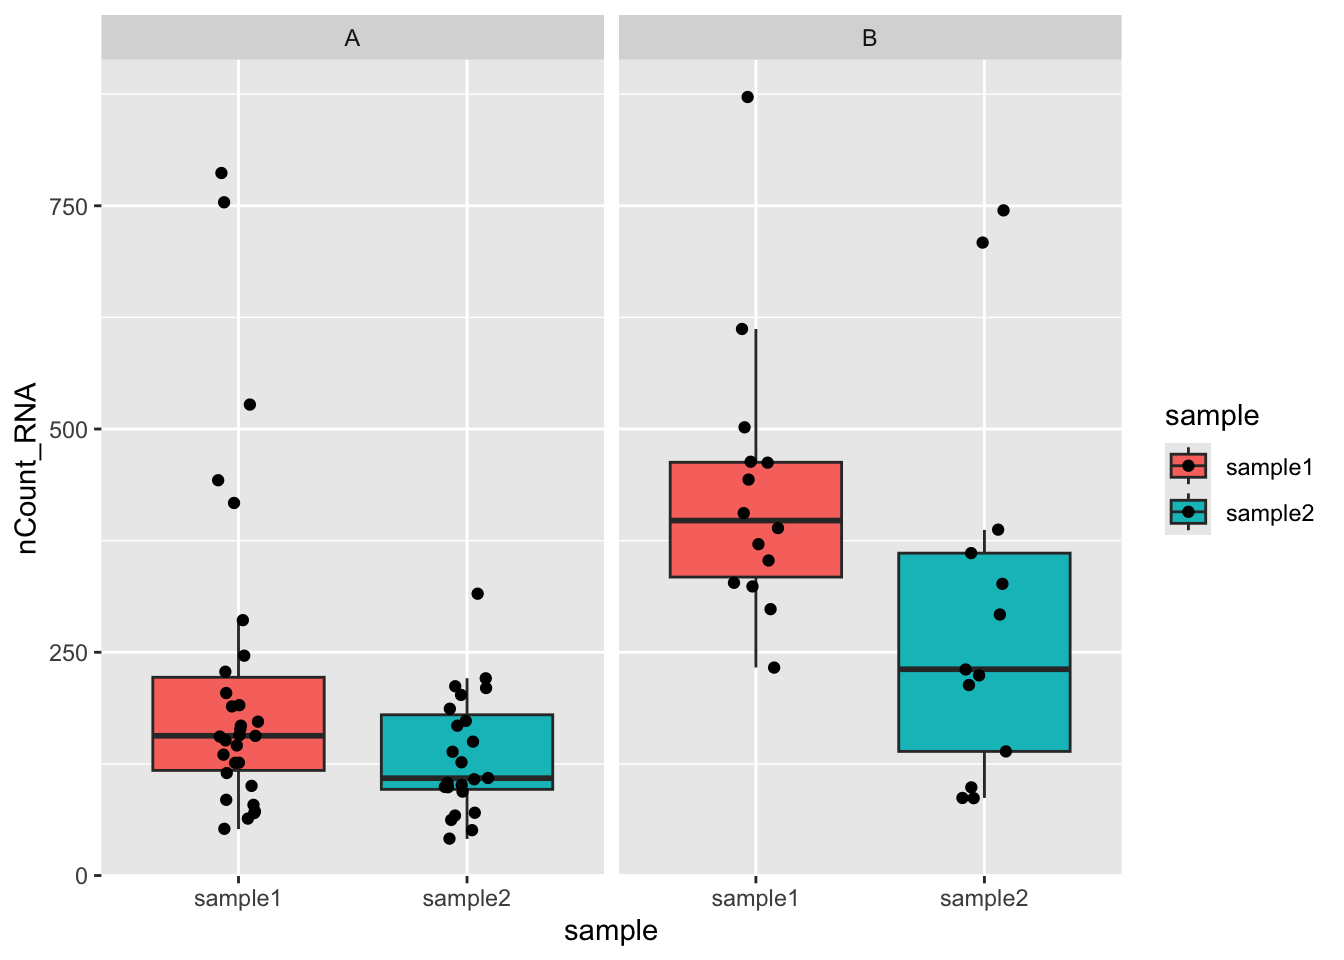
Further reading
To read more about the tidyomics packages, please refer to the tidyomics GitHub organization page.
Session info
Click to display session info
sessionInfo()
#> R version 4.5.1 (2025-06-13)
#> Platform: x86_64-apple-darwin20
#> Running under: macOS Ventura 13.7.6
#>
#> Matrix products: default
#> BLAS:   /Library/Frameworks/R.framework/Versions/4.5-x86_64/Resources/lib/libRblas.0.dylib
#> LAPACK: /Library/Frameworks/R.framework/Versions/4.5-x86_64/Resources/lib/libRlapack.dylib;  LAPACK version 3.12.1
#>
#> locale:
#> [1] en_US.UTF-8/en_US.UTF-8/en_US.UTF-8/C/en_US.UTF-8/en_US.UTF-8
#>
#> time zone: UTC
#> tzcode source: internal
#>
#> attached base packages:
#> [1] stats4    stats     graphics  grDevices utils     datasets  methods
#> [8] base
#>
#> other attached packages:
#>  [1] nullranges_1.15.0               plyranges_1.29.0
#>  [3] tidybulk_1.21.0                 tidyseurat_0.8.0
#>  [5] SeuratObject_5.1.0              sp_2.2-0
#>  [7] tidySingleCellExperiment_1.19.0 SingleCellExperiment_1.31.0
#>  [9] tidySummarizedExperiment_1.19.0 ttservice_0.4.1
#> [11] SummarizedExperiment_1.39.0     Biobase_2.69.0
#> [13] GenomicRanges_1.61.0            GenomeInfoDb_1.45.3
#> [15] IRanges_2.43.0                  S4Vectors_0.47.0
#> [17] BiocGenerics_0.55.0             generics_0.1.4
#> [19] MatrixGenerics_1.21.0           matrixStats_1.5.0
#> [21] ggplot2_3.5.2                   tidyr_1.3.1
#> [23] dplyr_1.1.4                     tidyomics_1.5.0
#> [25] BiocStyle_2.37.0
#>
#> loaded via a namespace (and not attached):
#>   [1] RcppAnnoy_0.0.22         splines_4.5.1            later_1.4.2
#>   [4] BiocIO_1.19.0            bitops_1.0-9             tibble_3.2.1
#>   [7] polyclip_1.10-7          preprocessCore_1.71.0    XML_3.99-0.18
#>  [10] fastDummies_1.7.5        lifecycle_1.0.4          globals_0.18.0
#>  [13] lattice_0.22-7           MASS_7.3-65              magrittr_2.0.3
#>  [16] plotly_4.10.4            rmarkdown_2.29           yaml_2.3.10
#>  [19] httpuv_1.6.16            Seurat_5.3.0             sctransform_0.4.2
#>  [22] spam_2.11-1              spatstat.sparse_3.1-0    reticulate_1.42.0
#>  [25] cowplot_1.1.3            pbapply_1.7-2            RColorBrewer_1.1-3
#>  [28] abind_1.4-8              Rtsne_0.17               purrr_1.0.4
#>  [31] RCurl_1.98-1.17          ggrepel_0.9.6            irlba_2.3.5.1
#>  [34] listenv_0.9.1            spatstat.utils_3.1-4     goftest_1.2-3
#>  [37] RSpectra_0.16-2          spatstat.random_3.4-1    fitdistrplus_1.2-2
#>  [40] parallelly_1.45.0        codetools_0.2-20         DelayedArray_0.35.1
#>  [43] tidyselect_1.2.1         UCSC.utils_1.5.0         farver_2.1.2
#>  [46] spatstat.explore_3.4-3   GenomicAlignments_1.45.0 jsonlite_2.0.0
#>  [49] ellipsis_0.3.2           progressr_0.15.1         ggridges_0.5.6
#>  [52] survival_3.8-3           tools_4.5.1              ica_1.0-3
#>  [55] Rcpp_1.0.14              glue_1.8.0               gridExtra_2.3
#>  [58] SparseArray_1.9.0        xfun_0.52                withr_3.0.2
#>  [61] BiocManager_1.30.25      fastmap_1.2.0            fansi_1.0.6
#>  [64] digest_0.6.37            R6_2.6.1                 mime_0.13
#>  [67] scattermore_1.2          tensor_1.5               spatstat.data_3.1-6
#>  [70] utf8_1.2.5               data.table_1.17.4        rtracklayer_1.69.0
#>  [73] InteractionSet_1.37.0    httr_1.4.7               htmlwidgets_1.6.4
#>  [76] S4Arrays_1.9.0           uwot_0.2.3               pkgconfig_2.0.3
#>  [79] gtable_0.3.6             lmtest_0.9-40            XVector_0.49.0
#>  [82] htmltools_0.5.8.1        dotCall64_1.2            scales_1.4.0
#>  [85] png_0.1-8                spatstat.univar_3.1-3    knitr_1.50
#>  [88] tzdb_0.5.0               reshape2_1.4.4           rjson_0.2.23
#>  [91] nlme_3.1-168             curl_6.2.3               zoo_1.8-14
#>  [94] stringr_1.5.1            KernSmooth_2.23-26       parallel_4.5.1
#>  [97] miniUI_0.1.2             restfulr_0.0.15          pillar_1.10.2
#> [100] grid_4.5.1               vctrs_0.6.5              RANN_2.6.2
#> [103] promises_1.3.3           xtable_1.8-4             cluster_2.1.8.1
#> [106] evaluate_1.0.3           isoband_0.2.7            readr_2.1.5
#> [109] cli_3.6.5                compiler_4.5.1           Rsamtools_2.25.0
#> [112] rlang_1.1.6              crayon_1.5.3             future.apply_1.11.3
#> [115] labeling_0.4.3           plyr_1.8.9               stringi_1.8.7
#> [118] viridisLite_0.4.2        deldir_2.0-4             BiocParallel_1.43.2
#> [121] Biostrings_2.77.1        lazyeval_0.2.2           spatstat.geom_3.4-1
#> [124] Matrix_1.7-3             RcppHNSW_0.6.0           hms_1.1.3
#> [127] patchwork_1.3.0          future_1.58.0            shiny_1.10.0
#> [130] ROCR_1.0-11              igraph_2.1.4