library(BiocFileCache)
#> Loading required package: dbplyr

# Create a BiocFileCache instance
bfc <- BiocFileCache()

# Download the xlsx file from Ensembl and cache it locally using BiocFileCache
xlsx_url <- "https://genome.cshlp.org/content/suppl/2020/11/16/gr.265934.120.DC1/Supplemental_Table_S2.xlsx"
xlsx_file <- bfcrpath(bfc, xlsx_url)

# The file is now downloaded and available
xlsx_file
#>                                                                                                   BFC1
#> "/Users/runner/Library/Caches/org.R-project.R/R/BiocFileCache/39b123f5aca2_Supplemental_Table_S2.xlsx"How to use tidy principles for genomic ranges manipulation
2025-06-19
Source:vignettes/how-to-use-tidy-principles-for-granges-manipulation.qmd
Tidy data principles are a set of principles for structuring data in a way that makes it easier to manipulate and analyze. They have been popularized by the tidyverse collection of R packages, which includes dplyr for data manipulation and ggplot2 for data visualization. The tidy principles can also be applied to biological data, such as RNA-seq data, to facilitate analysis and visualization, thanks to the tidyomics meta-package.
Bioconductor packages used in this document
How to manipulate GRanges objects with tidy principles
For illustration, we are going to download a xlsx file provided as a Supplementary Data in (Serizay et al. 2020), and manipulate it using tidy principles.
Good practices recommended by the Bioconductor consortium suggest to use the BiocFileCache package to download and cache files from remote servers.
Excel files can be read into tibbles in R thanks to the read_xlsx() function from the readxl package.
library(readxl)
tbl <- read_xlsx(xlsx_file, sheet = "ATAC_metrics", skip = 2)
tbl
#> # A tibble: 47,514 × 32
#> chrom_ce11 start_ce11 end_ce11 annot_dev_age_tissues annot_dev_age_tissues_…¹
#> <chr> <dbl> <dbl> <chr> <chr>
#> 1 chrI 328 478 other_element no_transcription
#> 2 chrI 864 1014 other_element no_transcription
#> 3 chrI 1901 2051 putative_enhancer transcription_initiation
#> 4 chrI 3827 3977 non-coding_RNA unassigned_promoter
#> 5 chrI 4277 4427 putative_enhancer no_transcription
#> 6 chrI 11273 11423 coding_promoter coding_promoter
#> 7 chrI 13071 13221 putative_enhancer no_transcription
#> 8 chrI 15431 15581 unassigned_promoter transcription_initiation
#> 9 chrI 15723 15873 putative_enhancer transcription_initiation
#> 10 chrI 16075 16225 other_element no_transcription
#> # ℹ 47,504 more rows
#> # ℹ abbreviated name: ¹annot_dev_age_tissues_fwd
#> # ℹ 27 more variables: annot_dev_age_tissues_rev <chr>,
#> # promoter_gene_id_fwd <chr>, promoter_locus_id_fwd <chr>,
#> # promoter_gene_biotype_fwd <chr>, promoter_gene_id_rev <chr>,
#> # promoter_locus_id_rev <chr>, promoter_gene_biotype_rev <chr>,
#> # associated_gene_id <chr>, associated_locus_id <chr>, tss_fwd_ce11 <dbl>, …We convert it into a GRanges object directly using as_granges() from the plyranges package, using tidy evaluation as in dplyr package.
library(tidyomics)
#> ── Attaching core tidyomics packages ──────────────────────── tidyomics 1.5.0 ──
#> ✔ dplyr                    1.1.4      ✔ tidyr                    1.3.1
#> ✔ ggplot2                  3.5.2      ✔ tidyseurat               0.8.0
#> ✔ nullranges               1.15.0     ✔ tidySingleCellExperiment 1.19.0
#> ✔ plyranges                1.29.0     ✔ tidySummarizedExperiment 1.19.0
#> ✔ tidybulk                 1.21.0
#> ── Conflicts ────────────────────────────────────────── tidyomics_conflicts() ──
#> ✖ plyranges::between()     masks dplyr::between()
#> ✖ tidybulk::bind_cols()    masks ttservice::bind_cols(), dplyr::bind_cols()
#> ✖ plyranges::filter()      masks tidybulk::filter(), dplyr::filter(), stats::filter()
#> ✖ S4Vectors::findMatches() masks utils::findMatches()
#> ✖ S4Vectors::head()        masks utils::head()
#> ✖ plyranges::n()           masks dplyr::n()
#> ✖ plyranges::n_distinct()  masks dplyr::n_distinct()
#> ✖ IRanges::relist()        masks BiocGenerics::relist(), utils::relist()
#> ✖ tidybulk::rename()       masks S4Vectors::rename(), dplyr::rename()
#> ✖ plyranges::slice()       masks IRanges::slice(), dplyr::slice()
#> ✖ IRanges::stack()         masks S4Vectors::stack(), utils::stack()
#> ✖ S4Vectors::tail()        masks utils::tail()
#> ✖ tidyseurat::tidy()       masks tidySingleCellExperiment::tidy(), tidySummarizedExperiment::tidy(), generics::tidy()
#> ℹ Use the conflicted package (<http://conflicted.r-lib.org/>) to force all conflicts to become errors
gr <- tbl |>
    as_granges(seqnames = chrom_ce11, start = start_ce11, end = end_ce11)
gr
#> GRanges object with 47514 ranges and 29 metadata columns:
#>           seqnames            ranges strand | annot_dev_age_tissues
#>              <Rle>         <IRanges>  <Rle> |           <character>
#>       [1]     chrI           328-478      * |         other_element
#>       [2]     chrI          864-1014      * |         other_element
#>       [3]     chrI         1901-2051      * |     putative_enhancer
#>       [4]     chrI         3827-3977      * |        non-coding_RNA
#>       [5]     chrI         4277-4427      * |     putative_enhancer
#>       ...      ...               ...    ... .                   ...
#>   [47510]     chrX 17702756-17702906      * |   unassigned_promoter
#>   [47511]     chrX 17711839-17711989      * |       coding_promoter
#>   [47512]     chrX 17714483-17714633      * |     putative_enhancer
#>   [47513]     chrX 17714955-17715105      * |     putative_enhancer
#>   [47514]     chrX 17718452-17718602      * |         other_element
#>           annot_dev_age_tissues_fwd annot_dev_age_tissues_rev
#>                         <character>               <character>
#>       [1]          no_transcription          no_transcription
#>       [2]          no_transcription          no_transcription
#>       [3]    transcription_initia..    transcription_initia..
#>       [4]       unassigned_promoter            non-coding_RNA
#>       [5]          no_transcription    transcription_initia..
#>       ...                       ...                       ...
#>   [47510]    transcription_initia..       unassigned_promoter
#>   [47511]          no_transcription           coding_promoter
#>   [47512]    transcription_initia..    transcription_initia..
#>   [47513]    transcription_initia..    transcription_initia..
#>   [47514]          no_transcription          no_transcription
#>           promoter_gene_id_fwd promoter_locus_id_fwd promoter_gene_biotype_fwd
#>                    <character>           <character>               <character>
#>       [1]                    .                     .                         .
#>       [2]                    .                     .                         .
#>       [3]                    .                     .                         .
#>       [4]                    .                     .                         .
#>       [5]                    .                     .                         .
#>       ...                  ...                   ...                       ...
#>   [47510]                    .                     .                         .
#>   [47511]                    .                     .                         .
#>   [47512]                    .                     .                         .
#>   [47513]                    .                     .                         .
#>   [47514]                    .                     .                         .
#>           promoter_gene_id_rev promoter_locus_id_rev promoter_gene_biotype_rev
#>                    <character>           <character>               <character>
#>       [1]                    .                     .                         .
#>       [2]                    .                     .                         .
#>       [3]                    .                     .                         .
#>       [4]       WBGene00023193              Y74C9A.6                    snoRNA
#>       [5]                    .                     .                         .
#>       ...                  ...                   ...                       ...
#>   [47510]                    .                     .                         .
#>   [47511]       WBGene00019189              H11L12.1            protein_coding
#>   [47512]                    .                     .                         .
#>   [47513]                    .                     .                         .
#>   [47514]                    .                     .                         .
#>           associated_gene_id associated_locus_id tss_fwd_ce11 tss_rev_ce11
#>                  <character>         <character>    <numeric>    <numeric>
#>       [1]                  .                   .          463          342
#>       [2]                  .                   .          999          878
#>       [3]                  .                   .         2009         1957
#>       [4]                  .                   .         3906         3908
#>       [5]     WBGene00022277              homt-1         4412         4363
#>       ...                ...                 ...          ...          ...
#>   [47510]                  .                   .     17702913     17702741
#>   [47511]                  .                   .     17711974     17711853
#>   [47512]     WBGene00007069              6R55.2     17714605     17714477
#>   [47513]     WBGene00007068           cTel55X.1     17715037     17714998
#>   [47514]     WBGene00007068           cTel55X.1     17718587     17718466
#>           newly_annotated Germline_RPM Neurons_RPM Muscle_RPM Hypod._RPM
#>                 <logical>    <numeric>   <numeric>  <numeric>  <numeric>
#>       [1]            TRUE       45.719       1.424      1.134      2.578
#>       [2]            TRUE       43.748       4.362      4.218      8.489
#>       [3]           FALSE       58.300       4.206      3.958      4.545
#>       [4]           FALSE      729.297      84.286    203.708     96.350
#>       [5]           FALSE       31.131       6.148      5.033      6.894
#>       ...             ...          ...         ...        ...        ...
#>   [47510]           FALSE        9.051       3.128      4.679      3.518
#>   [47511]            TRUE       13.429       1.580      1.950      1.182
#>   [47512]           FALSE       51.752      11.670     14.639     26.422
#>   [47513]           FALSE       17.429       3.473      3.005      3.646
#>   [47514]           FALSE       80.090       4.099     11.997      9.589
#>           Intest._RPM 1st.max.tissue 2nd.max.tissue 3rd.max.tissue
#>             <numeric>    <character>    <character>    <character>
#>       [1]       2.915       Germline        Intest.         Hypod.
#>       [2]       7.998       Germline         Hypod.        Intest.
#>       [3]       7.806       Germline        Intest.         Hypod.
#>       [4]     213.660       Germline        Intest.         Muscle
#>       [5]       7.655       Germline        Intest.         Hypod.
#>       ...         ...            ...            ...            ...
#>   [47510]      38.540        Intest.       Germline         Muscle
#>   [47511]       3.266       Germline        Intest.         Muscle
#>   [47512]      65.473        Intest.       Germline         Hypod.
#>   [47513]       8.771       Germline        Intest.         Hypod.
#>   [47514]      15.883       Germline        Intest.         Muscle
#>           4th.max.tissue 5th.max.tissue ratio.1v2 ratio.2v3 ratio.3v4 ratio.4v5
#>              <character>    <character> <numeric> <numeric> <numeric> <numeric>
#>       [1]        Neurons         Muscle   9.77487  1.202422  1.739127  0.883113
#>       [2]        Neurons         Muscle   3.45646  1.007397  1.762534  0.797460
#>       [3]        Neurons         Muscle   4.77063  1.708645  1.020881  0.846640
#>       [4]         Hypod.        Neurons   2.24205  0.719981  3.072214  0.928693
#>       [5]        Neurons         Muscle   2.78961  1.077880  0.880588  1.132635
#>       ...            ...            ...       ...       ...       ...       ...
#>   [47510]         Hypod.        Neurons   6.61420  0.895639  1.893015  1.043766
#>   [47511]        Neurons         Hypod.   3.05009  1.158554  1.558102  1.448557
#>   [47512]         Muscle        Neurons   1.99632  1.284442  1.260975  1.454653
#>   [47513]        Neurons         Muscle   1.31179  2.442015  0.805662  0.929136
#>   [47514]         Hypod.        Neurons   3.20781  1.035116  1.615237  2.277067
#>                       Annotation
#>                      <character>
#>       [1]               Germline
#>       [2]               Germline
#>       [3]               Germline
#>       [4] Germline_Muscle_Inte..
#>       [5]           Unclassified
#>       ...                    ...
#>   [47510]           Unclassified
#>   [47511]               Germline
#>   [47512]           Ubiq.-Biased
#>   [47513]           Unclassified
#>   [47514]               Germline
#>   -------
#>   seqinfo: 6 sequences from an unspecified genome; no seqlengths
Let’s say we are not interested in all the metadata columns, and we want to keep only the annot_dev_age_tissues, Annotation, and the columns ending with _RPM. We can use the select() function from dplyr to select these columns, just like we would do with a data.frame or tibble.
gr <- gr |>
    select(annot_dev_age_tissues, Annotation, ends_with("_RPM"))
gr
#> GRanges object with 47514 ranges and 7 metadata columns:
#>           seqnames            ranges strand | annot_dev_age_tissues
#>              <Rle>         <IRanges>  <Rle> |           <character>
#>       [1]     chrI           328-478      * |         other_element
#>       [2]     chrI          864-1014      * |         other_element
#>       [3]     chrI         1901-2051      * |     putative_enhancer
#>       [4]     chrI         3827-3977      * |        non-coding_RNA
#>       [5]     chrI         4277-4427      * |     putative_enhancer
#>       ...      ...               ...    ... .                   ...
#>   [47510]     chrX 17702756-17702906      * |   unassigned_promoter
#>   [47511]     chrX 17711839-17711989      * |       coding_promoter
#>   [47512]     chrX 17714483-17714633      * |     putative_enhancer
#>   [47513]     chrX 17714955-17715105      * |     putative_enhancer
#>   [47514]     chrX 17718452-17718602      * |         other_element
#>                       Annotation Germline_RPM Neurons_RPM Muscle_RPM Hypod._RPM
#>                      <character>    <numeric>   <numeric>  <numeric>  <numeric>
#>       [1]               Germline       45.719       1.424      1.134      2.578
#>       [2]               Germline       43.748       4.362      4.218      8.489
#>       [3]               Germline       58.300       4.206      3.958      4.545
#>       [4] Germline_Muscle_Inte..      729.297      84.286    203.708     96.350
#>       [5]           Unclassified       31.131       6.148      5.033      6.894
#>       ...                    ...          ...         ...        ...        ...
#>   [47510]           Unclassified        9.051       3.128      4.679      3.518
#>   [47511]               Germline       13.429       1.580      1.950      1.182
#>   [47512]           Ubiq.-Biased       51.752      11.670     14.639     26.422
#>   [47513]           Unclassified       17.429       3.473      3.005      3.646
#>   [47514]               Germline       80.090       4.099     11.997      9.589
#>           Intest._RPM
#>             <numeric>
#>       [1]       2.915
#>       [2]       7.998
#>       [3]       7.806
#>       [4]     213.660
#>       [5]       7.655
#>       ...         ...
#>   [47510]      38.540
#>   [47511]       3.266
#>   [47512]      65.473
#>   [47513]       8.771
#>   [47514]      15.883
#>   -------
#>   seqinfo: 6 sequences from an unspecified genome; no seqlengths
In fact, most verbs from the dplyr package can be used with GRanges objects, such as filter(), mutate(), arrange(), group_by() and summarise().
gr |>
    mutate(start = start - 1000, end = end + 1000) |>
    filter(start > 1e6) |>
    arrange(Intest._RPM) |>
    group_by(annot_dev_age_tissues, Annotation) |>
    summarize(n = plyranges::n())
#> DataFrame with 182 rows and 3 columns
#>     annot_dev_age_tissues             Annotation         n
#>               <character>            <character> <integer>
#> 1         coding_promoter               Germline       885
#> 2         coding_promoter        Germline_Hypod.        21
#> 3         coding_promoter Germline_Hypod._Inte..         8
#> 4         coding_promoter       Germline_Intest.        19
#> 5         coding_promoter        Germline_Muscle        39
#> ...                   ...                    ...       ...
#> 178   unassigned_promoter Neurons_Muscle_Intest.        32
#> 179   unassigned_promoter                   Soma        94
#> 180   unassigned_promoter                  Ubiq.        56
#> 181   unassigned_promoter           Ubiq.-Biased       176
#> 182   unassigned_promoter           Unclassified       607
Note that the summarize() function automatically returns a DataFrame, not a GRanges object.
To enhance compatibility with the tidyverse ecosystem, the plyranges package provides a as_tibble() method for GRanges objects, which converts them into tibbles. This allows you to use pass GRanges objects to ggplot for visualization.
gr |>
    filter(Annotation %in% c("Intest.", "Hypod.", "Soma", "Ubiq.")) |>
    as_tibble() |>
    ggplot(aes(x = `Intest._RPM`, y = `Hypod._RPM`, color = Annotation)) +
    geom_point() +
    labs(x = "Intestine RPM", y = "Hypodermis RPM") +
    facet_grid(Annotation~annot_dev_age_tissues) +
    theme_bw() +
    theme(legend.position = "bottom")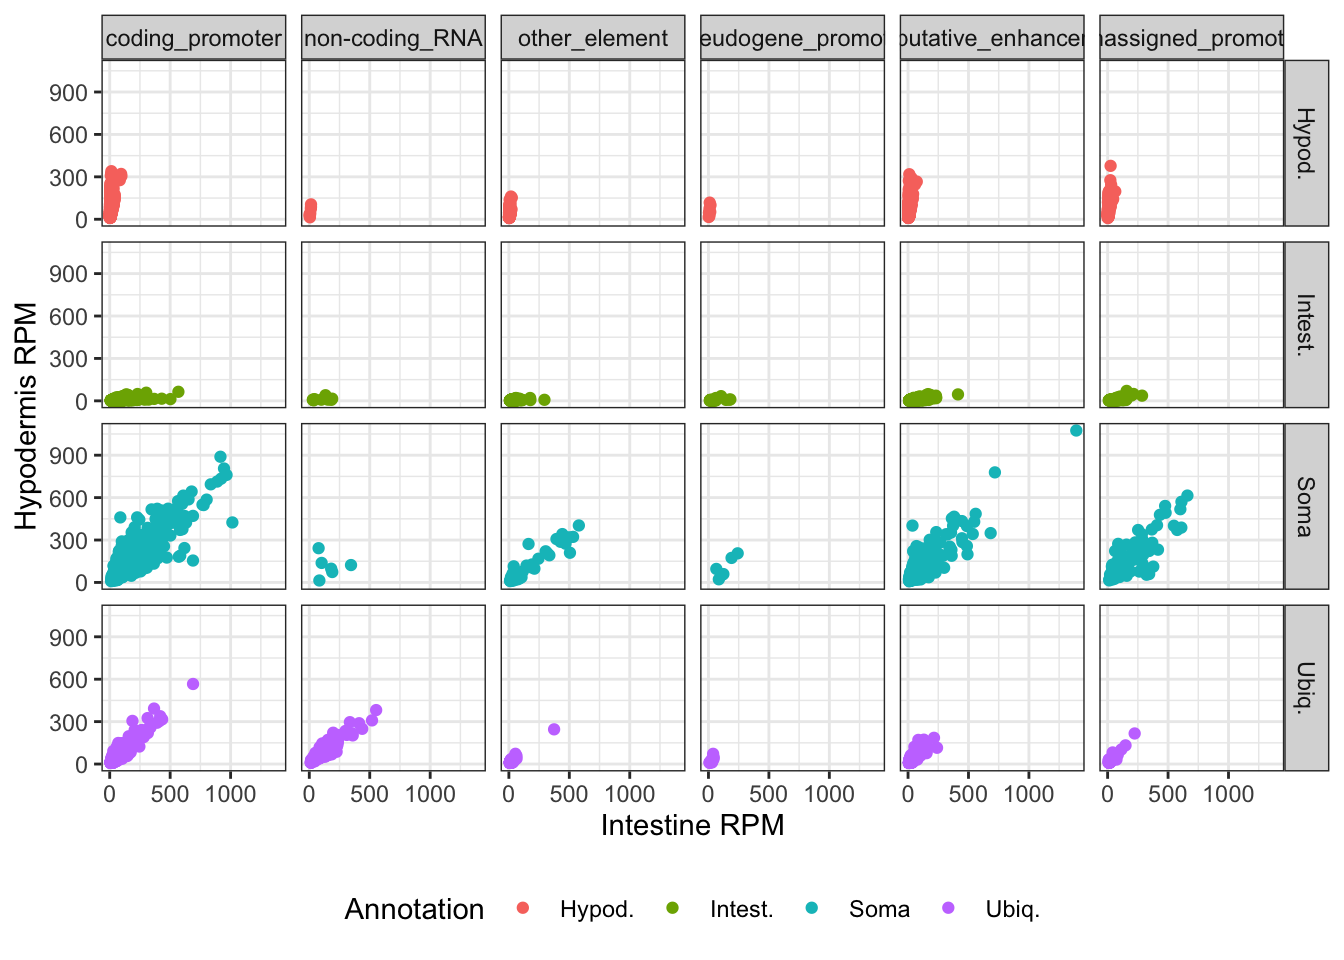
Finally, the join concept introduced by the dplyr package can also be applied to GRanges objects. In this case, the operation refers to joining overlapping, nearest, or preceding/following ranges, using the join_*_*() function from the plyranges package.
As an example, we can compare annotations from (Serizay et al. 2020) to chromosome arms/center
arms <- GRanges(
    seqnames = rep(c("chrI", "chrII", "chrIII", "chrIV", "chrV", "chrX"), each = 3),
    ranges = IRanges(
        start = c(
            1, 4550001, 10750001,
            1, 4550001, 10750001,
            1, 4450001, 10150001,
            1, 4750001, 12650001,
            1, 4850001, 16250001,
            1, 2850001, 14250001
        ),
        end = c(
            4550000, 10750000, 15072423,
            4550000, 10750000, 15279345,
            4450000, 10150000, 13783700,
            4750000, 12650000, 17493793,
            4850000, 16250000, 20924149,
            2850000, 14250000, 17718866
        )
    ),
    strand = "*",
    part = rep(c("arm", "center", "arm"), 6)
)

gr |>
    join_overlap_left(arms) |>
    group_by(Annotation, part) |>
    filter(Annotation %in% c("Germline", "Neurons")) |>
    summarize(n = plyranges::n())
#> DataFrame with 4 rows and 3 columns
#>    Annotation        part         n
#>   <character> <character> <integer>
#> 1    Germline         arm      1081
#> 2    Germline      center      1103
#> 3     Neurons         arm      1100
#> 4     Neurons      center      1628
Further reading
To read more about the tidyomics packages, please refer to the tidyomics GitHub organization page.
More tutorials are provided by the tidyomics GitHub organization in the tidy-ranges-tutorial website.
References
Serizay, Jacques, Yan Dong, Jürgen Jänes, Michael Chesney, Chiara Cerrato, and Julie Ahringer. 2020. “Distinctive regulatory architectures of germline-active and somatic genes in C. elegans.” Genome Res. 30 (12): 1752–65. https://doi.org/10.1101/gr.265934.120.
Session info
Click to display session info
sessionInfo()
#> R version 4.5.1 (2025-06-13)
#> Platform: x86_64-apple-darwin20
#> Running under: macOS Ventura 13.7.6
#>
#> Matrix products: default
#> BLAS:   /Library/Frameworks/R.framework/Versions/4.5-x86_64/Resources/lib/libRblas.0.dylib
#> LAPACK: /Library/Frameworks/R.framework/Versions/4.5-x86_64/Resources/lib/libRlapack.dylib;  LAPACK version 3.12.1
#>
#> locale:
#> [1] en_US.UTF-8/en_US.UTF-8/en_US.UTF-8/C/en_US.UTF-8/en_US.UTF-8
#>
#> time zone: UTC
#> tzcode source: internal
#>
#> attached base packages:
#> [1] stats4    stats     graphics  grDevices utils     datasets  methods
#> [8] base
#>
#> other attached packages:
#>  [1] nullranges_1.15.0               plyranges_1.29.0
#>  [3] tidybulk_1.21.0                 tidyseurat_0.8.0
#>  [5] SeuratObject_5.1.0              sp_2.2-0
#>  [7] tidySingleCellExperiment_1.19.0 SingleCellExperiment_1.31.0
#>  [9] tidySummarizedExperiment_1.19.0 ttservice_0.4.1
#> [11] SummarizedExperiment_1.39.0     Biobase_2.69.0
#> [13] GenomicRanges_1.61.0            GenomeInfoDb_1.45.3
#> [15] IRanges_2.43.0                  S4Vectors_0.47.0
#> [17] BiocGenerics_0.55.0             generics_0.1.4
#> [19] MatrixGenerics_1.21.0           matrixStats_1.5.0
#> [21] ggplot2_3.5.2                   tidyr_1.3.1
#> [23] dplyr_1.1.4                     tidyomics_1.5.0
#> [25] readxl_1.4.5                    BiocFileCache_2.99.5
#> [27] dbplyr_2.5.0                    BiocStyle_2.37.0
#>
#> loaded via a namespace (and not attached):
#>   [1] RcppAnnoy_0.0.22         splines_4.5.1            later_1.4.2
#>   [4] BiocIO_1.19.0            bitops_1.0-9             filelock_1.0.3
#>   [7] tibble_3.2.1             cellranger_1.1.0         polyclip_1.10-7
#>  [10] preprocessCore_1.71.0    XML_3.99-0.18            fastDummies_1.7.5
#>  [13] lifecycle_1.0.4          httr2_1.1.2              globals_0.18.0
#>  [16] lattice_0.22-7           MASS_7.3-65              magrittr_2.0.3
#>  [19] plotly_4.10.4            rmarkdown_2.29           yaml_2.3.10
#>  [22] httpuv_1.6.16            Seurat_5.3.0             sctransform_0.4.2
#>  [25] spam_2.11-1              spatstat.sparse_3.1-0    reticulate_1.42.0
#>  [28] cowplot_1.1.3            pbapply_1.7-2            DBI_1.2.3
#>  [31] RColorBrewer_1.1-3       abind_1.4-8              Rtsne_0.17
#>  [34] purrr_1.0.4              RCurl_1.98-1.17          rappdirs_0.3.3
#>  [37] ggrepel_0.9.6            irlba_2.3.5.1            listenv_0.9.1
#>  [40] spatstat.utils_3.1-4     goftest_1.2-3            RSpectra_0.16-2
#>  [43] spatstat.random_3.4-1    fitdistrplus_1.2-2       parallelly_1.45.0
#>  [46] codetools_0.2-20         DelayedArray_0.35.1      tidyselect_1.2.1
#>  [49] UCSC.utils_1.5.0         farver_2.1.2             spatstat.explore_3.4-3
#>  [52] GenomicAlignments_1.45.0 jsonlite_2.0.0           ellipsis_0.3.2
#>  [55] progressr_0.15.1         ggridges_0.5.6           survival_3.8-3
#>  [58] tools_4.5.1              ica_1.0-3                Rcpp_1.0.14
#>  [61] glue_1.8.0               gridExtra_2.3            SparseArray_1.9.0
#>  [64] xfun_0.52                withr_3.0.2              BiocManager_1.30.25
#>  [67] fastmap_1.2.0            fansi_1.0.6              digest_0.6.37
#>  [70] R6_2.6.1                 mime_0.13                scattermore_1.2
#>  [73] tensor_1.5               spatstat.data_3.1-6      RSQLite_2.3.11
#>  [76] utf8_1.2.5               data.table_1.17.4        rtracklayer_1.69.0
#>  [79] InteractionSet_1.37.0    httr_1.4.7               htmlwidgets_1.6.4
#>  [82] S4Arrays_1.9.0           uwot_0.2.3               pkgconfig_2.0.3
#>  [85] gtable_0.3.6             blob_1.2.4               lmtest_0.9-40
#>  [88] XVector_0.49.0           htmltools_0.5.8.1        dotCall64_1.2
#>  [91] scales_1.4.0             png_0.1-8                spatstat.univar_3.1-3
#>  [94] knitr_1.50               rjson_0.2.23             tzdb_0.5.0
#>  [97] reshape2_1.4.4           nlme_3.1-168             curl_6.2.3
#> [100] cachem_1.1.0             zoo_1.8-14               stringr_1.5.1
#> [103] KernSmooth_2.23-26       parallel_4.5.1           miniUI_0.1.2
#> [106] restfulr_0.0.15          pillar_1.10.2            grid_4.5.1
#> [109] vctrs_0.6.5              RANN_2.6.2               promises_1.3.3
#> [112] xtable_1.8-4             cluster_2.1.8.1          evaluate_1.0.3
#> [115] readr_2.1.5              Rsamtools_2.25.0         cli_3.6.5
#> [118] compiler_4.5.1           rlang_1.1.6              crayon_1.5.3
#> [121] future.apply_1.11.3      labeling_0.4.3           plyr_1.8.9
#> [124] stringi_1.8.7            BiocParallel_1.43.2      viridisLite_0.4.2
#> [127] deldir_2.0-4             Biostrings_2.77.1        lazyeval_0.2.2
#> [130] spatstat.geom_3.4-1      Matrix_1.7-3             RcppHNSW_0.6.0
#> [133] hms_1.1.3                patchwork_1.3.0          bit64_4.6.0-1
#> [136] future_1.58.0            shiny_1.10.0             ROCR_1.0-11
#> [139] igraph_2.1.4             memoise_2.0.1            bit_4.6.0